Executive Dashboard & Subscription Overview
Get an instant operational pulse on your tenant from the Admin Console Home Dashboard ( /) and track live Monthly Recurring Users (MRUs), Admin Seats, and billing history in Subscription Overview ( /overview).
1. Admin Console Executive Dashboard (/)
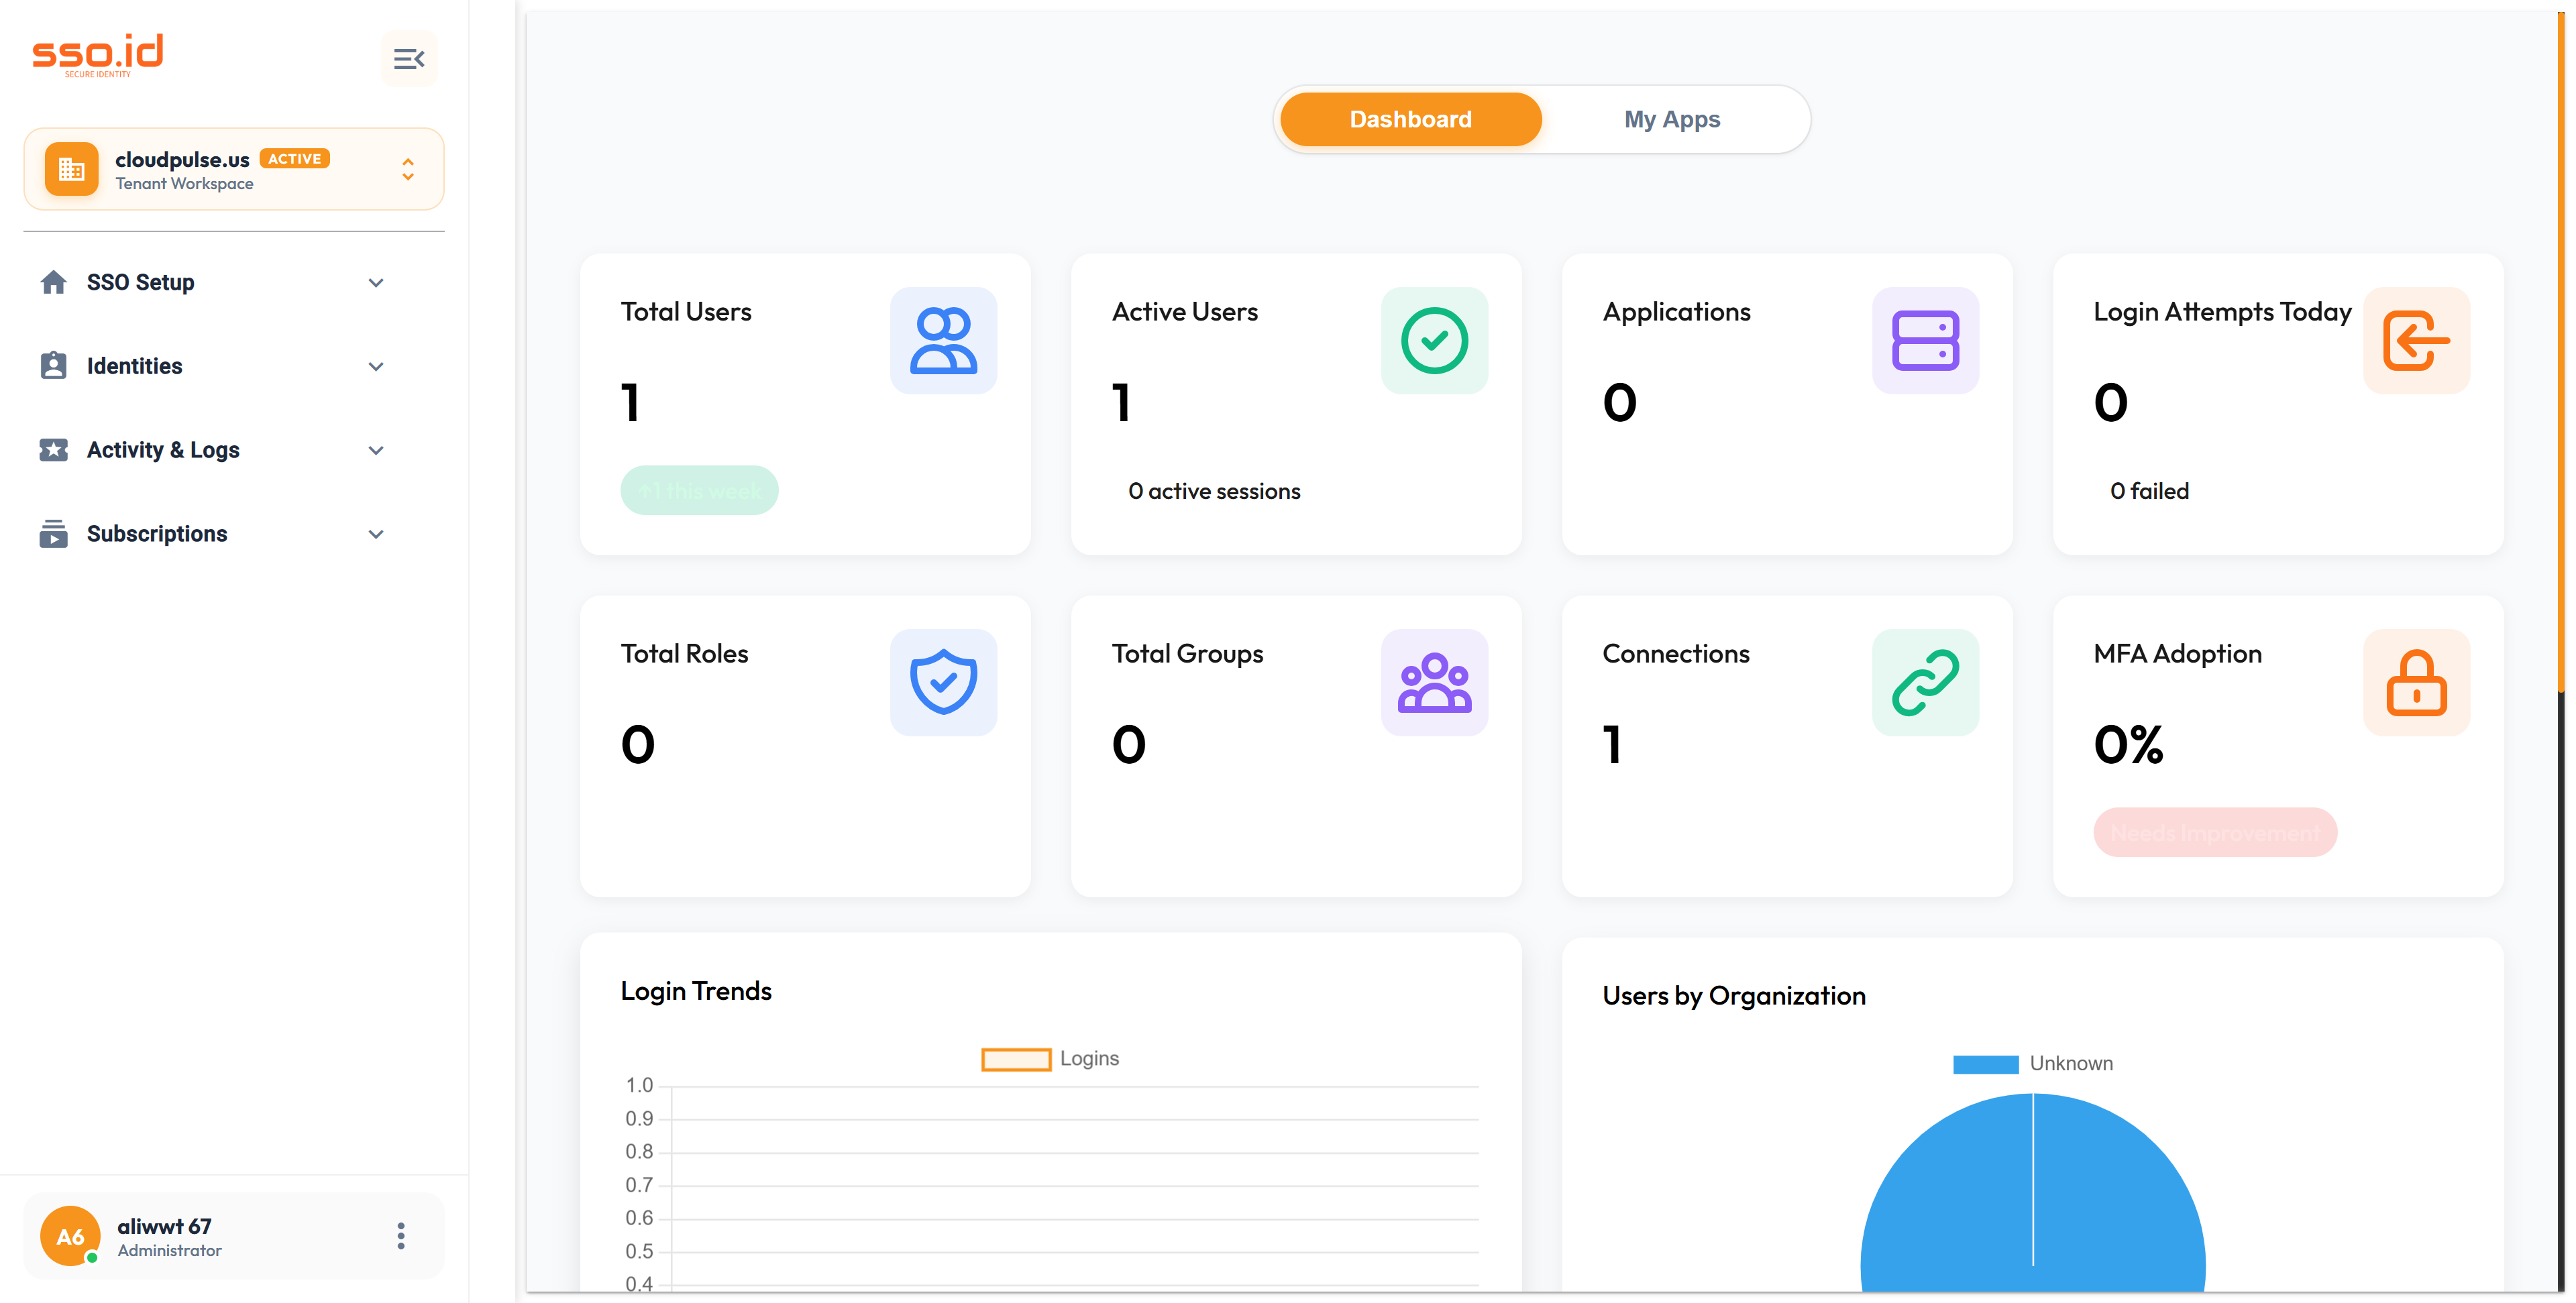
Signing into your tenant Admin Console lands on the real-time Executive Dashboard, surfacing authentication volume, security alerts, connection health, and compliance readiness in a single view:
Login Trends & Active KPIs
Tracks total logins, failed attempts, MFA challenges, active users, registered applications, and configured connections across configurable time windows.
Security Alerts, Compliance & Connection Health
Highlights impossible travel detections, brute-force lockouts, overall compliance posture (GDPR, HIPAA, SOC 2, ISO 27001), and live external IdP reachability.
2. Subscription & Resource Usage Overview (/overview)
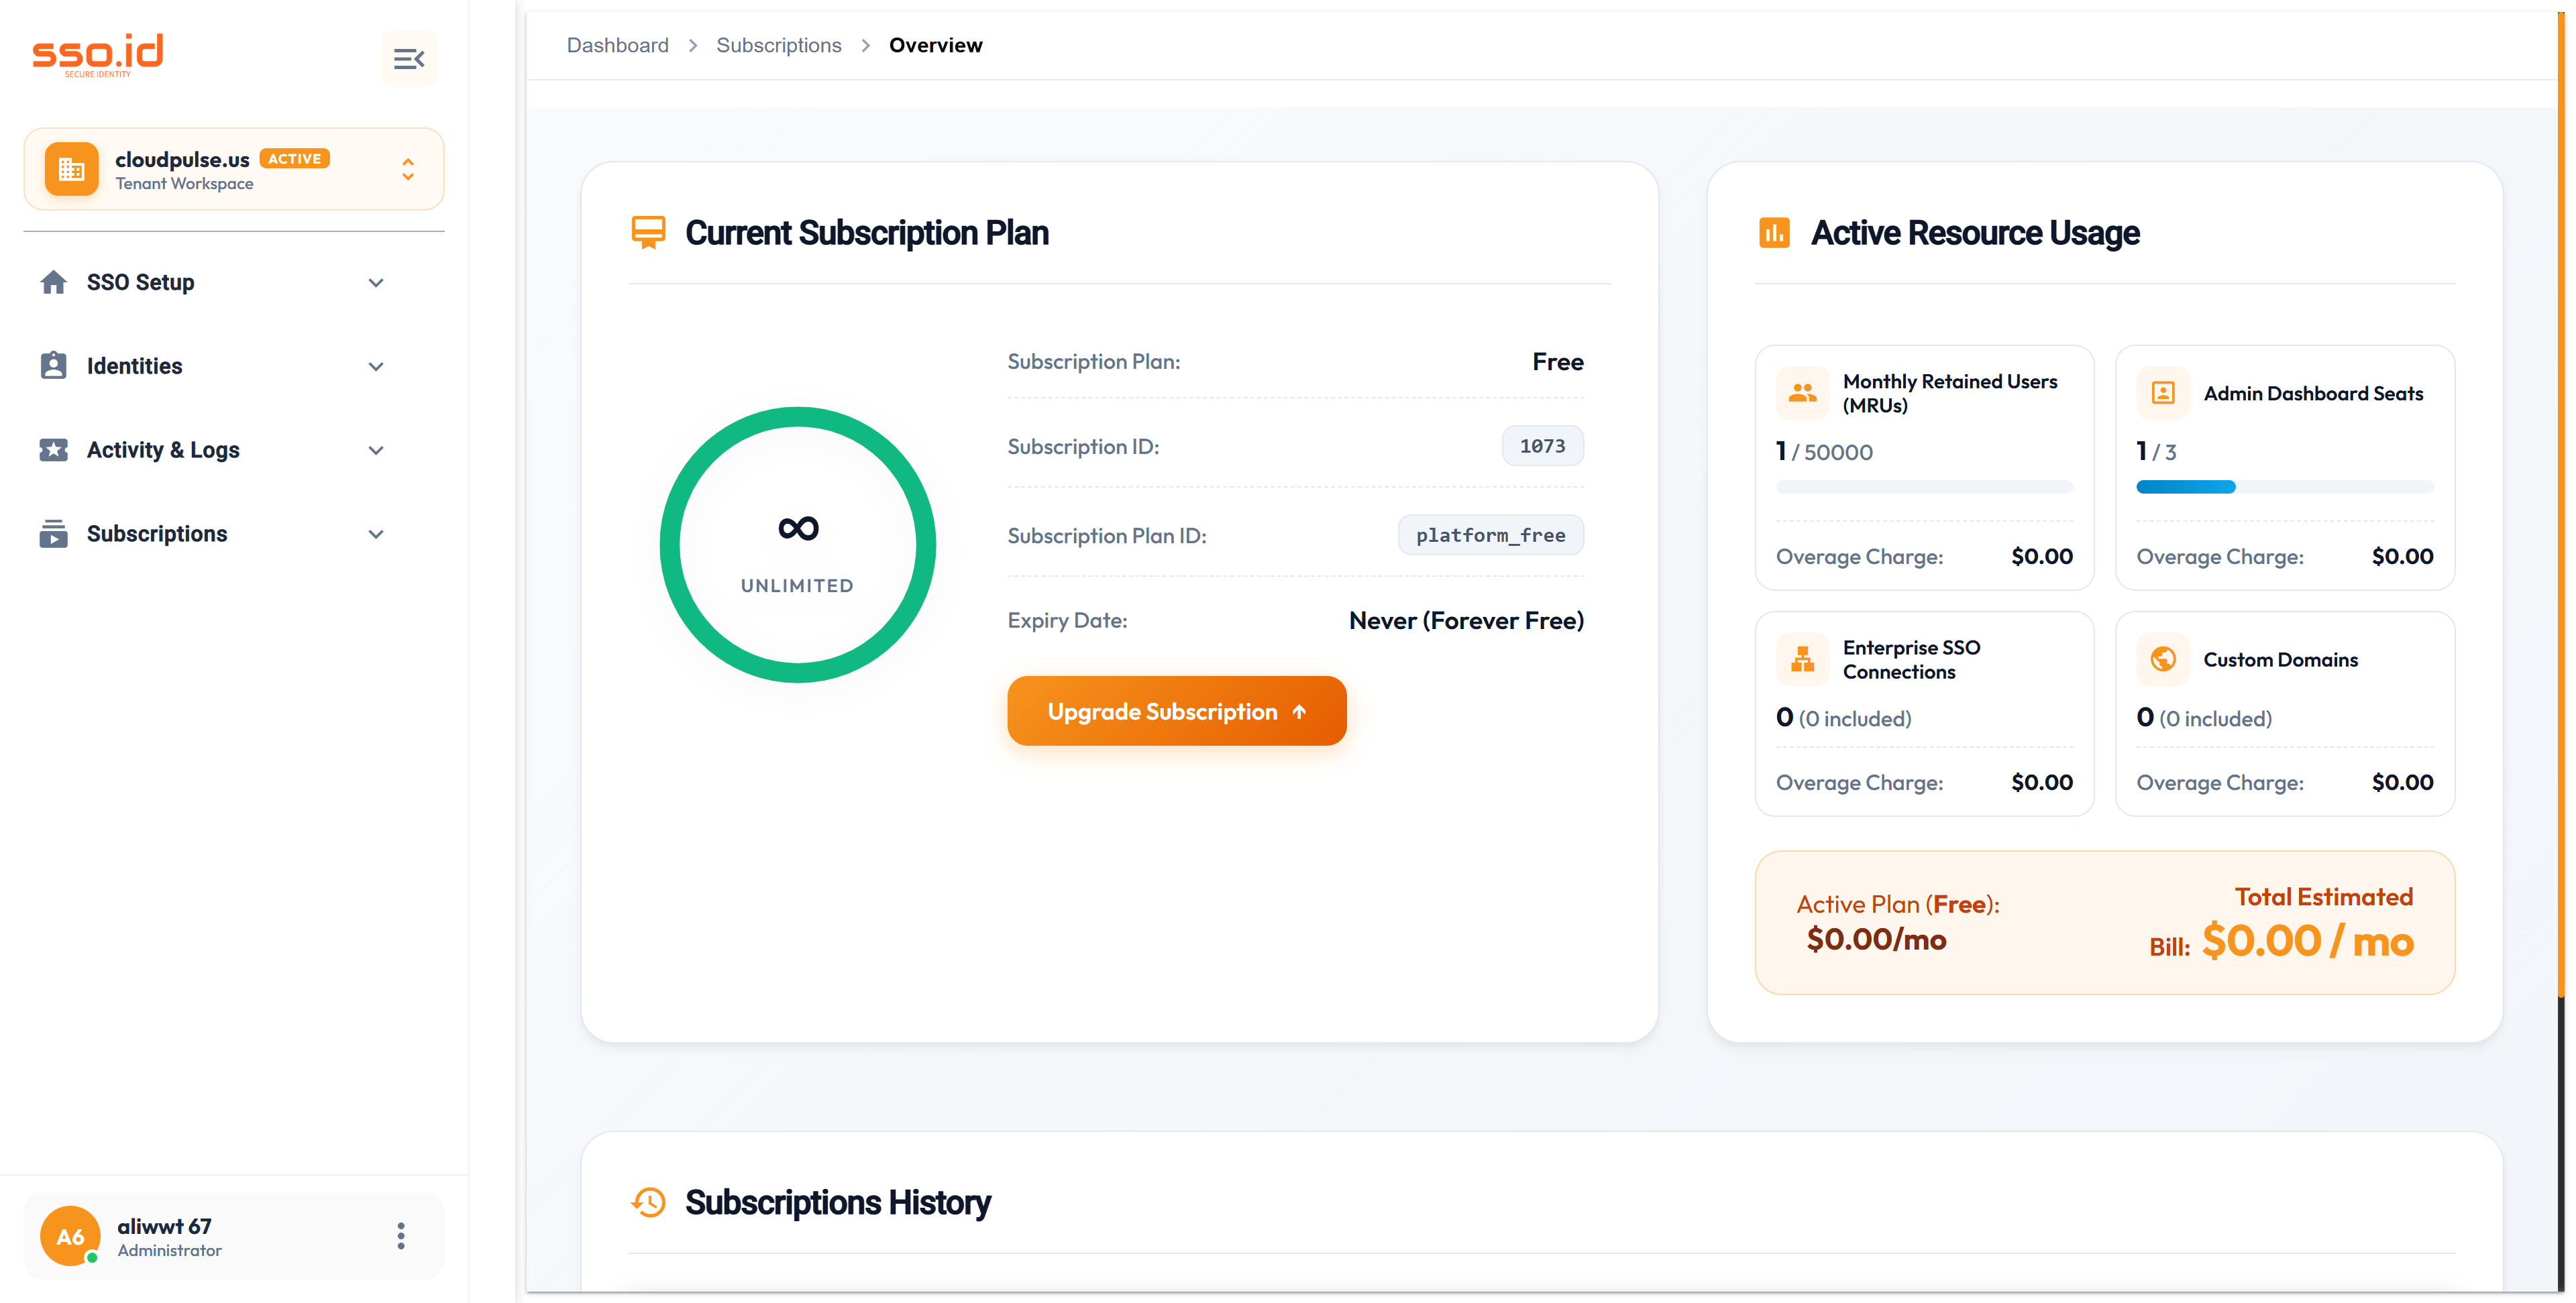
Navigate to Subscriptions → Overview ( /overview) to monitor your current plan tier, active resource consumption against plan quotas, and historical Stripe subscription invoices:
- Active Plan Card: Displays your active plan tier (e.g.,
Free (platform_free),Pro, orBusiness), billing cadence, and renewal status. - Active Resource Usage Meters: Live progress bars for Monthly Recurring Users (MRUs), Admin Seats, Applications, and Enterprise Connections.
- Subscription History Table: Lists past and current subscription periods, payment status, and invoice references.
3. Dashboard & Usage API Reference
| Method | Endpoint | Description |
|---|---|---|
| GET | https://{your-tenant}.sso.id/api/stripe/usage-summary |
Returns live MRU, Admin Seat, Application, and Connection usage counts against active tenant plan quotas. |
| GET | https://{your-tenant}.sso.id/api/compliance/readiness-report |
Returns overall compliance percentage and per-framework control scores shown on the dashboard. |
| GET | https://{your-tenant}.sso.id/api/user-activity |
Feeds login trends, recent sign-in telemetry, and security alert widgets. |